LONGEVITY OF CD MEDIA
RESEARCH AT THE LIBRARY OF CONGRESS
Chandru J. Shahani, Basil Manns and Michele Youket
Preservation Research and Testing Division
Library of Congress, Washington DC, USA
Abstract
Investigations into the aging of CD-Audio media currently in progress at the Library of Congress are described. Aging trends under natural as well as accelerated conditions are under study. A natural aging study consisting of a pilot project designed to monitor the long-term effects of real-life storage and use conditions on the integrity of a limited sample population selected randomly from the Library’s CD collection is described. This sample population is retained within the collection and remains subject to normal wear and tear, and is withdrawn only briefly for periodic testing every few years. Results obtained over the past seven years from this pilot project are discussed with implications for the future course of this investigation. Also presented is the status of an accelerated aging study of CD-Audio media currently in progress. Visual observations of defects generated as a result of the accelerated aging process are presented.
The goal of these studies is to gain an understanding of the scope of the challenge that may lie ahead for the long- term preservation of a contemporary CD collection that must inevitably comprise a wide range of compositional characteristics in every layer of its manufacture. It is hoped that this research will ultimately enable us to 1) provide the best long-term protection for our collections, 2) establish relevant parameters for monitoring CDs that would signal the need for creating backup copies or migration of data, and 3) identify the failure mechanisms that arise form deficiencies in the manufacture of CD’s.
Introduction
Ever since their advent, optical storage media have had a strong appeal for preservation-conscious institutions because of their presumed potential to last indefinitely since they are not subject to the same wear and tear as other recorded media. This is why the Library of Congress has long been committed to gaining an understanding of the lasting qualities of optical storage media. The earliest studies at the Library date back to accelerated aging studies with 12-inch optical WORM discs during the mid eighties. An accelerated aging study was undertaken to investigate the application of the Arrhenius aging methodology for the determination of an end-of-life point for the discs in question. Specific test procedures were developed for these analyses and formalized in ANSI standard X3.199 1991 (1). Later, with support from NIST, AIIM developed an error-monitoring scheme for the WORM, MO, and the CD optical media (2,3). These tests involved accelerated aging of the discs in an elevated temperature and humidity environment typically for repeated periods of 500 to 2000 hours to accelerate potential chemical changes that may affect the operational characteristics of the discs. At about that time, IT9, an ANSI standards committee, was developing life-expectancy procedures for digital optical media and approved three standards dealing with CD ROM media (4).
A primary objective of the current research is to assess the preservation needs of the CD-Audio collections at the Library of Congress, and to devise strategies to minimize any data losses that may result as the collections continue to age. To this end, an essential first step is to gain an understanding of failure modes by monitoring errors that may accumulate upon aging of CDs. New insights might also be gained through a scientific examination of any visually perceptible defects as well. It is our hope that we will ultimately be able to link compositional characteristics of individual CDs to failure mechanisms in a way that would enable us to flag more vulnerable CDs for replication or backup so as to preserve the data before any of it is lost.
The effects of the aging process on CDs have been studied in this work under accelerated as well as natural aging conditions. The accelerated aging study was modeled after the ANSI standard mentioned above (4). Although these experiments are still in progress and some of the data sets have yet to be completed, several interesting observations have been recorded about the development of physical defects that are clearly visible in some of the discs. The nature of these defects and their impact on the playability of the discs has been presented here. However, like most accelerated aging experiments, this series of experiments also begs the question whether the failure modes observed here are truly representative of phenomena that occur in real life, and if the differences that will soon emerge in the aging of CDs with different manufacturing characteristics would ultimately stand the test of time.
In anticipation of these inevitable doubts, a natural aging study that monitors the aging of a representative sample of CDs was initiated in 1996. With the limited resources for testing of CDs available to us at that time, this initiative was restricted to a pilot study with a limited sample of 125 discs selected randomly from the total population of the Library’s CD collection, which at that time was estimated to consist of 60,000 items. While this was not a statistically significant sample, its size was deemed adequate enough to enable us to justify a full-fledged natural aging study if significant data errors were to develop in even a few discs. Indeed, that is exactly what has transpired as will be seen from the data presented below. In the eight years since this study was initiated, the size of the Library’s CD collection has mushroomed from 60,000 to 380,000. A statistically valid random sample is being assembled at present for a more definitive natural aging study.
I. Natural aging study
Experimental
Test population: A randomly selected test population of 125 CDs was selected to represent the Library’s collection of 60,000 CDs. These CDs were to be withdrawn from the collection only for a brief time for the purpose of periodic testing. The intent was to let this population experience the same wear and tear as the rest of the collection. The disadvantage was that in subsequent years, this test sample was reduced by 6 CDs, which could not be retrieved most likely because of removal of duplicates from the collection.
Testing methodology: A specialized tester, the CD-CATS/SA3 (5), designed specifically for CDs according to the Philips Red / Blue / Green / Orange Book standards, ISO9660 and extensions (6) was used to read and test the CDs for 25 test parameters according to the physical specification of CDs as defined in ISO 10149 (7). In addition to the ISO specifications, the tester also measures jitter and effect of length deviation based upon production level requirements of Phillips and Sony. Definitions of these test parameters along with the ISO documents are accessible in published literature (5,7), and their acronyms and brief definitions have been included in the Appendix as well. It is generally accepted that these measurements and statistics are important indicators of CD operability.
The test results are grouped by the CD-CATS system into three data categories: static data, dynamic data, and the recommended length deviation and jitter data. BLER, E32, and jitter are perhaps the three most widely used indicators of errors or potential problems, although many other parameters will give an indication of undesirable changes.
The tester also generates an “OUT-OF-SPEC. LIST”, based on the maximum or minimum values for each parameter as specified by the user of the CD-CATS system, a useful reporting mechanism for flagging or monitoring levels or errors. An out-of-specification level does not necessarily indicate an error, as it depends on the nature of the parameter in error and where on the disc the error occurred. A simple example of the irrelevance of an observed “error” is one which might have occurred on an area of the disc where no data is recorded.
Testing Frequency: The selected test population was first subjected to testing in 1996 to establish the baseline test parameters for each of the 125 CDs. This testing of individual CDs was repeated in 1999 (Run 2) and again in 2003 (Run 3). We plan to continue to repeat this testing every 3 years.
Results and Discussion
When digital optical media first became available, they appeared to have an edge over other recorded media since it was commonly believed that they would be free of the wear and tear that traditional media suffer every time they are played. However, now and then there have been some catastrophic failures when CDs have been rendered unplayable either as a result of some unintentional abuse such as the penetration of an adhesive from a label or writing with a pen which penetrated the protective coating under the label, or a defect in their construction that somehow made them more vulnerable to the aging process. In 1996, when the size of the CD-Audio collection at the Library numbered about 60,000, we decided to initiate a program in which the condition of a representative sample of CDs selected randomly from the total population would be monitored periodically to explore the possibility of error generation in these CDs while they were allowed to remain as an integral part of their collection. They would continue to remain in their place in the collection and be subject to the same probability of being played as the rest of the collection. Every few years they would be withdrawn from the collection to be tested in a non destructive manner.
Back-of-the-envelope calculations suggested at that time that a random sample of 125 CDs would adequately represent the collection to gauge the aging process within a 90% confidence limit. Another practical circumstance that persuaded us to limit the sample size of this test population was the limited resources for testing individual CDs available to us at the time this project was designed. Within a few years after the study was initiated, it became evident that our CD-Audio collection was growing exponentially, and the size of the test sample would need to be increased appreciably for it to truly represent the fast-growing collection. Having already embarked on this project, we decided to limit our expectation of this project rather than abandon it and start over, so that we reduced this study to the level of a pilot project, the results of which would be used to decide if a full-fledged study with a statistically valid sample would be justified.
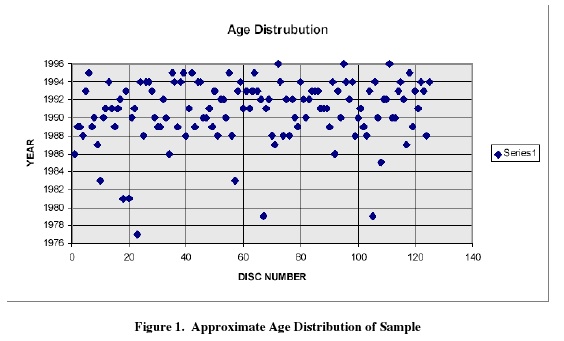
Figure 1 represents the 125 discs in terms of their copyright date or production date as specified on the CD itself, its cover or in the literature accompanying the CD. This date may not be the exact date of manufacture, but it is the best date we could associate with the given CD. For all practical purposes we can assume that this sample does represent the age distribution of the Library’s CD collection in 1996. The increasing sample density in the later years, which is clearly evident from the simple representation shown here, is only to be anticipated given the growing acceptance at first and ultimately the dominant position of CD media in the music publishing world.
Examination of the Test Data: All test parameters were collected from the CD-CATS system for each of the 125 CDs in the test. All CDs were run at X1 speed and 100% sampling was used. To date three successive tests were conducted, Baseline, Run 2 and Run 3. The only figure of importance for each of the measured parameters is the cumulative change from the baseline value rather than their absolute value at anytime. Absolute values of these parameters would naturally include the impact of the manufacturing process as well as the effects of aging and physical handling up to the time we initiated this study. Our concern is limited to the effects of natural aging from that point onwards.
All error functions were tabulated and used to draw inferences in comparison to other related errors, such as the correlation between BLER and E32. Also of interest are the parameters that change with time. A disc may be manufactured with certain errors on a particular part of a particular track that will show up as an error, but will have no effect on the playability or reading any of the useful data. Therefore, before any judgment can be made as to an “error”, the specific measurement needs to be carefully examined as to where it occurred and what other parameters indicated an error at the same time.
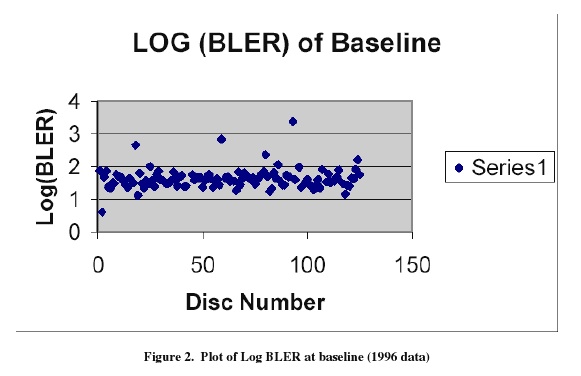
BLER is often considered a good general indicator for an assessment of the condition of a disc. Often there is a correlation between BLER and some of the other test parameters mentioned above, although sometimes there are unexplainable exceptions to this fact. A scatter plot of the BLER for the baseline run of the sample of 125 discs is shown in Figure 2. Scatter plots for Run 2 and Run 3 data for BLER follow in Figure 3 and Figure 4.
It is common knowledge that the technology of the manufacture of CDs has undergone extensive improvement over the years that encompass the period of this study, which includes all CDs made until 1996. Therefore, it is most interesting to note that for disc number 23, which has an associative date of 1977, the BLER remained relatively constant during the three test runs, being 36, 34, and 36. Likewise, disc numbers 66 and 105, both of which also date back to the late 1970’s, exhibited little change in the BLER. Thus, some of the CDs manufactured with the earliest technology are holding up very well thus far 25 years or longer after their manufacture.
While BLER has been highlighted in this discussion and scatter charts are presented only for this parameter, it is obviously not the only parameter that merits attention. Similar scatter plots as those shown here for BLER were also plotted for all other parameters as well in order to discern if any correlations between different parameters could be deduced. Relationships between parameters can be instructive for a particular disc where for example, the BLER may be high but the E32 low, or where the BLER and E32 occurred at about the same time. Surface presentation can be used to determine the location of errors on the disc. These types of analyses were conducted, but because of the sheer volume of data generated, these are not included here.
Four discs had a BLER greater than the generally acceptable maximum rate of 220, or log(BLER) of about 2.34. These discs are numbered 18, 59, 80, and 93. These same discs also exhibited E32 errors, fatal uncorrectable errors. However, there was no noticeable audio defect in the recording; that is, all the four discs were playable. If any of the errors were in the data sectors, they were evidently correctable.
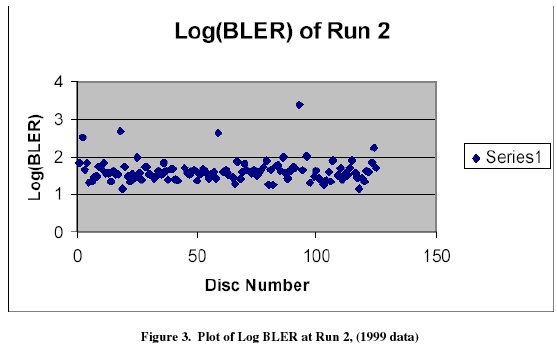
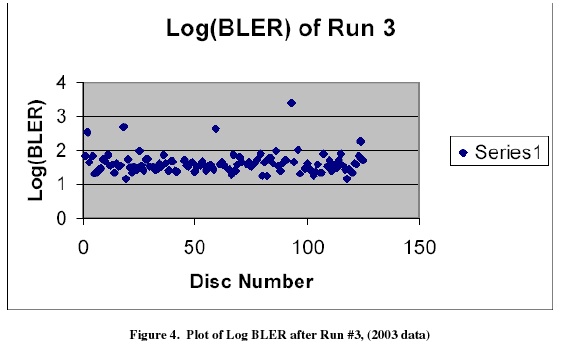
Figure 3 shows the results after Run 2. Note for disc number 2, the BLER went from 4 to 355, while for disc number 80 the BLER went from 228 to 18. The latter change is harder to comprehend. The only rational explanation that occurs to us is that a speck of dust residing on the reflective side of disc 80 might have been the cause of the initial higher BLER reading, and the subsequent decline in BLER upon the removal of this spec after routine cleaning. Each of the discs was cleaned using an isopropyl alcohol wipe before introducing it in the CD-CATS tester. Other parameters for this disc remained about the same or normal for a typical measurement. Discs numbered 18, 59, and 93 showed little change and were all in excess of the standard limit for all three runs. Discs numbered 18 and 59 had readings of BLER in the mid 400’s while disc number 93 had a BLER in the range of 2300.
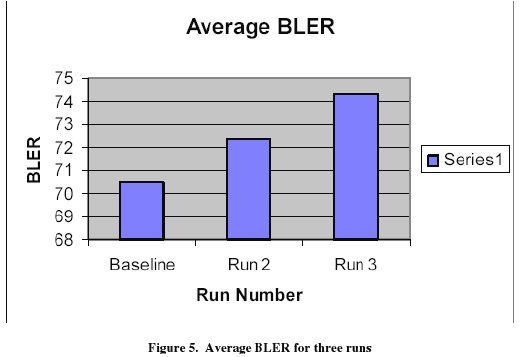
The BLER data by themselves to not reveal any significant variations from successive runs, except for disc 2 and disc 80. As already indicted, we have ascribed the downward change in BLER for disc 80 to an experimental aberration. However, the rise in BLER for disc 2 is real. Figure 5, below, shows an average BLER for the entire sample for each of the three runs. The upward drift in the average value of BLER does indicate a worsening trend. Further measurements scheduled for 2006 would be valuable in lending definitive confirmation of this trend or denying it.
Other parameters analyzed include normalized reflectivity. The scatter plot for this property was fairly flat and only two CDs were out of specification for reflectivity. However, these two CDs did not have any E32 errors and the BLER were within specification, suggesting that these reflectivity “errors” were not significant, but worth observing for later runs. There are different ways of calculating this parameter and it is often an indication of surface dirt or scratches, which will not always result in a fatal error.
Radial noise was also examined. All CDs were within specification for this property except for disc number 68. However, no other parameter was out of specification for this disc. A high value of radial noise can occur due to poorly defined pits, which may result from production flaws, surface dirt or scratches, or other factors affecting or interfering with the return signal such as birefringence. Again, the importance of this parameter is only in the comparison with the sample in order to observe changes and examine the possible cause of such errors as they may occur in future years.
Finally, maximum length deviation distributions and maximum jitter distributions on both the land and the pit region were also monitored. These are critical test parameters that generally provide a good indication of significant error levels. Whenever an E32 error occurs along with high BLER levels, the land length deviation and jitter maximums are generally out of specification as well.
Table I presents all errors, or parameters above pre-established levels, for all three runs. The numbers represent the number of occurrences the test parameter exceeded the pre-defined level, as a percent of the total sample. The pre defined levels are specified in reference 6 and 7. The parameters are summarized in the Appendix.
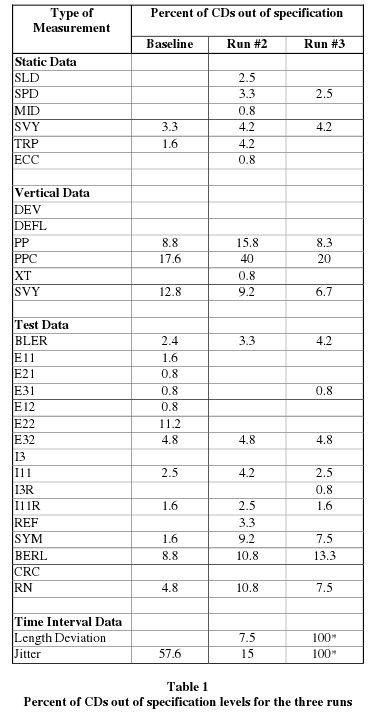
It is important to note the significant increase in Length Deviation and Jitter in the last run. Length Deviation is the length of each pit and land area measurement compared to the ideal for each time interval, 3T to 11T. Jitter is measured individually for each pit and land 3T to 11T transition. Jitter is measured for the entire track, then calculated and expressed statistically, as a standard deviation.
Bit error can be predicted based on length deviation, signal jitter, and player jitter. Low jitter does not always indicate high quality, but can indicate low average error rates. Jitter does not indicate local defects, such as black spots, birefringence, or scratches.
There are other parameters and specific changes to evaluate on a case-by-case basis. Physical examination using a microscope is also important to look for surface defects or other physical abnormalities. Such analyses are in progress, but no definitive observations are available for presentation at this time.
In the short span of 9 years for which data has been obtained and analyzed for this project under natural aging conditions, measurable changes have been noticed in the condition of the limited test population under study. One of the discs showed a significant rise in BLER, and the average BLER for the test population shows an upward drift. Also the Length Deviation and Jitter show a noticeable increment in the last run in 2003.
II. Accelerated Aging Studies
Experimental
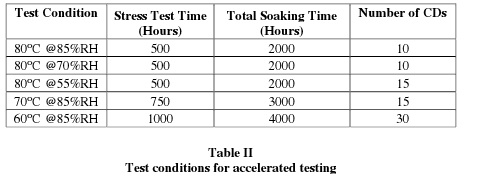
Accelerated aging was based on ANSI NPM IT9.21 as described in reference 4. The test conditions are summarized below. Eighty CD-ROMs were used in each batch and the batch is divided into five groups according to the table below. Each group is tested, then placed in the stress chamber for the specified stress time, and re-tested for the BLER and all the other parameters. This process is repeated 4 times until the total soaking time is achieved. The sampling size is sufficient to arrive at a cumulative failure distribution, using the Weibull Distribution (4). The Eyring Model (4) may then be applied to generate a life expectancy for the sample.
Results and Discussion
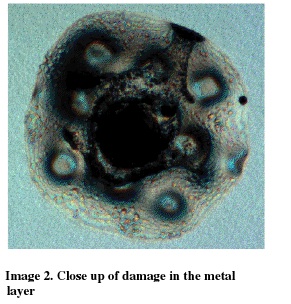
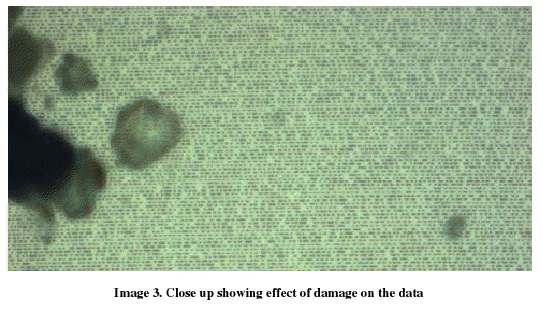
The accelerated aging experiments are still in progress. However, even after the first 500 hours of accelerated aging time under the conditions specified above, some significant failure modes have been observed. With increasing aging time, these failures seem to become more significant. We have roughly classified the observable failures into three major types. The first are spots appearing on the CD. There are a number of different types of spots - black, white and bubbles - not all of which we understand at present. Some seem to form on the polycarbonate or reflective surface. Others seem to form within the surface, and some on the metal reflective layer, either on the reflective side or causing aberrations on the label side. Image 1 shows a disc with a conglomeration of such spots. These spots were not formed by the condensation of water within the CD structure as can happen if the relative humidity within the aging chamber is not slowly ramped up when aging is initiated and ramped down just as gradually before the termination of an aging period, and are therefore the result of the aging process itself. A magnified view of a spot on the metal layer is presented in Image 2, while image 3 shows how such chemical degradation can wipe out recorded data.
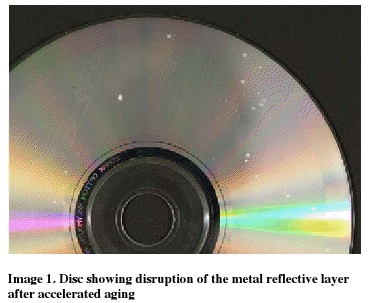
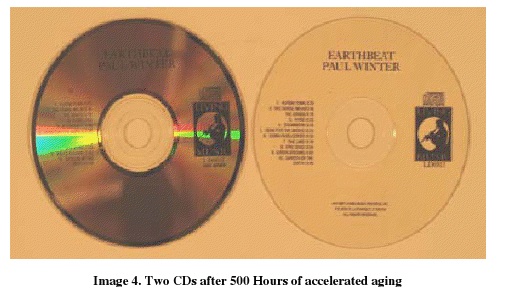
Another failure mode observed is the visual disappearance of the metal layer, which is shown in Image 4. The reflectivity of the metallic aluminum or aluminum alloy layer of the disc is lost both to the eye and to the read laser. The only logical explanation that suggests itself for the observed transparentization of the reflective layer is that the seal around the edge of the disc either was not implemented in the manufacture of this disc, or it was somehow compromised in the aging process, thus rendering the aluminum vulnerable to oxidation. This phenomenon occurs gradually. Only time will tell if it will be replicated under natural aging conditions, although the possibility appears real. This phenomenon was noticed only with one type of disc. Interestingly enough, some of the printing on the disc appears to exert a protective effect since the reflectivity under the printed image is retained. It is hard to imagine how the printing provides a seal against the environment in these areas, but we are not in a position to offer a more logical cause for this observation at this time. Today’s manufacturing technology provides a much better seal all around the CD, and such a degradation mode, even if real, would be limited to CDs of early manufacture.
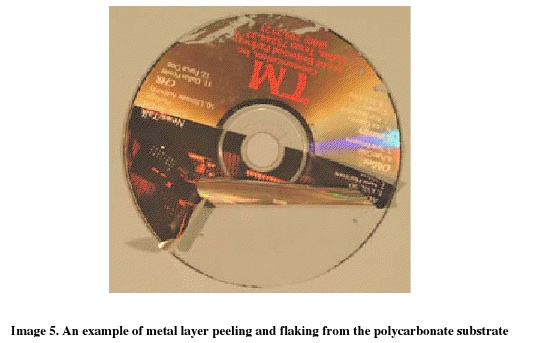
A third significant failure mode is the peeling or flaking off of the metal layer. We observed this type of failure on a CD that had been cycled between hot and cold temperatures. The disc in Image 5 shows both peeling and flaking, but these effects can occur separately. The sample failure shown here is not an isolated case, but rather an extreme one of its kind. This particular CD was exposed to both hot and cold temperatures. The IT-9 standard does not address cold temperature cycles, and this experiment was undertaken merely to satisfy our curiosity about the effect of extremes of temperature that a CD might experience under some circumstances such as while being played in a car during the winter months. In some rare cases we have observed similar, although more limited, flaking of the metal layer when the discs were subjected to elevated temperatures without cycling. The mechanism appears to be shrinking of the resin protective layer that, being attached strongly to the metal layer, causes it to peel away from the polycarbonate substrate.
Conclusion
Although the natural aging pilot project has been in progress for only seven years, the limited data obtained thus far has demonstrated a slight increase in the BLER and a significant increase in the length deviation and jitter measurements. These measurements only cover the CDs that were in the Library’s collection in 1996. The size of this collection has grown exponentially since that time. Therefore, a new natural aging study justified by the rising trend in BLER observed in the current study is being initiated. The sample size for this new study has been increased to above 1000 CDs so as to obtain data with a 95% confidence limit in its representation of the entire collection of 380,000 discs.
Accelerated aging of CD-ROM (mostly audio) has been time consuming and involves comparing similar manufactured CD’s under different environmental cycles. These experiments are nearing their conclusive stage and the data will be published in 2006.
The CD manufacturing process continues to be perfected - as changes in the selection of materials and improved surface conditions result in CDs of lower and lower BLER levels., It is hoped that the result of these changes will be that the frequency of failure, low as it has been observed thus far in our experiments, will appreciably decrease as improvements in construction continue to be instituted by the manufacturers.
References
1. ANSI X3.199 - 1991 Information Systems - 365mm (14.0 inch) Optical Disc Cartridge Write Once - Test Method for Media Characteristics.
2. ANSI AIIM MS59 - 1996 Media Error Monitoring and Reporting Techniques for Verification of Stored Data on Optical Digital Data Discs.
3. ANSI AIIM TR39 - 1996 Guidelines for the Use of Media Error Monitoring and Reporting Techniques for the Verification of Information Stored on Optical Digital Data Discs.
4. ANSI NPM IT9.21-1996 Life Expectancy of Compact Discs (CD-ROM) -- Method for Estimating, Based on Effects of Temperature and Relative Humidity. Similar reports were produced for Magneto-Optical (MO) Discs and CD-R media.
5. CD-CATS Users’ Manual, SA3, Audio Development, Inc., www.audiodev.com.
6. ISO 9660, Information processing – Volume and file structure of CD-ROM for information interchange.
7. ISO / IEC 10149, Information technology – Data interchange on read-only 120mm optical data disks (CD- ROM).
Appendix: Summary of Error Codes
SLD -- Start Lead. The optical start of the tracks. This value should be less than 46mm or the TOC (Table of Contents) may be missed.
SPD -- Start of Program. Diameter is used by the player to locate the start of TRK1 (track1).
MID -- Maximum Information Diameter signals the end of the disc. It should be less than 113 mm on a CD-ROM and less than 116 mm on a CD Audio. Handling often gives problems closer to the edge. If it is out of specification, it may result in a weak HF (high frequency) level and disturbed tracking due to birefringence, scratches and fingerprints from handling.
SVY -- Scanning Velocity is the speed with which the pits pass the reading spot.
TRP -- Track Pitch is the distance from the center of one track to the center of the adjacent track.
ECC -- Eccentricity is the measurement of how the geometrical center of the track of information measures with respect to the geometrical center hole of the disc.
DEV -- Deviation specification is + or - 0.5 mm. Deviation that is too high causes focusing problems, which in turn causes loss of the HF signal, higher BLER, and possibly the occurrence of E32s.
DEFL -- Deflection refers to the radial deflection of the light beam due to skew. Deflection + or - 1.6 degrees in the radial direction is the maximum allowable value. Deflection that is too high will result in loss of high frequency (HF) signal.
PP -- Push Pull is the variation in radial noise and is used to translate the wavelength of the noise into an amplitude measurement. The type of light used for this measurement, , either linear polarized light or circular polarized light, will vary the results.
PPC -- Push Pull is calculated for circular polarized light from linear polarized light according to Philips measurement correlation data.
XT -- Cross Talk is a measurement for the amount of noise present in the high frequency (HF) signal. XT should be less than 50%. High XT gives garbled HF signal, which in turn gives higher PP readings.
BLER -- Block Error Rate is the number of blocks of data that have at least one occurrence of erroneous data (E11 + E21 + E31). BLER is quantified as the rate of errors per second. BLER is critical because the errors need to be kept at the minimum to insure data integrity.
E11 -- E11 indicates how the existing errors are rated according to severity. . Measured in counts per second, E11 indicates the occurrence of single symbol correctable errors.
E21 -- E21 indicates how the existing errors are rated according to severity.. Measured in counts per second, E21 indicates the occurrence of double symbol correctable errors.
E31 -- E31 indicates how the existing errors are rated according to severity.. Measured in counts per second, E31 indicates the number of first decoder (C1) uncorrectable errors.
E12 -- E12 indicates the occurrence of single symbol correctable error in the second decoder (C2), measured in counts per second. As E31 errors penetrate to the second decoder, such errors can be further investigated by monitoring the E12, E22, and E32 readings. A high level of E12 is not significant, because one single E31 count can contain up to 30 E12 single symbol correctable errors, as a result of interleaving.
E22 -- E22 is a two symbol correctable error in the second decoder (C2) caused either by one big error or a very high degree of cluster errors. If E22 exists at all, the disc is approaching uncorrectable errors, and there is not much margin of error left to the user.
E32 -- E32 indicates uncorrectable errors in the C2 decoder or the existence of unreadable data on the disc. E32 should never be present on a CD.
I3 -- I3 is the HF level of the shortest pits and land areas of the disc. The I3 level should be kept between 0.3 and 0.7. I3 should never fall below 0.3 and should preferably be kept above 0.35. Maintaining this level on discs of more than 70 minutes is difficult. I3 levels which are too low result in decoding problems. Scratches and fingerprints from handling give a weak I3 level. I3 is measured by comparing levels with those on a reference disc having known values.
I11 -- I11 is the HF level of the longest pits and land areas of the disc. I11 should be kept above 0.6. I11 levels which are too low result in decoding problems. I11 is measured by comparing levels with those on a reference disc having known values.
I3R and I11R -- I3R and I11R are the ratios of I3 and I11 by the maximum. I3R and I11R measurements make it possible to distinguish between amplitude variations caused by pit deformation and amplitude variations caused by absorption in substratum and reflective layer. Measurements are normalized by the reflectivity. I3R and I11R make it possible to see if there are still good pits even though the signal level is low.
REF -- Reflectivity is calibrated with a good reference disc and is used for detection of reflection variations and normalization of I3R and I11R. Reflectivity is normalized by dividing the maximum level by 0.95.
SYM -- Symmetry is given as an absolute value. The specification for SYM is less than 20% for CD Audio discs, and less than 10% for a CD-ROM. SYM which is too high results in decoder level slicer problems, which would give a BLER reading that would be too high.
BERL -- Burst Error Length measurement counts the number of consecutive C2 blocks in error, normally indicating physical damage. Like E22, high BERL leaves little room for error, i.e., handling, dirt or scratches, after the disc is in use. BERL is important because it indicates the presence of a physical defect large enough to impact more than one block of data.
CRC -- Cyclic Redundancy Check shows the number of blocks per second, where CRC errors are detected. CRC is made on the subcode information.
RN -- Radial Noise has a limit of 30 nanometers within the bandwidth of 500 to 2500 Hz. RN occurs when tracks are damaged. High RN peaks causes the servo to skip tracks. High average RN is an indication of poorly defined pits (worn down stamper or mastering problem).
BEGL -- Burst Errors Greater than Limits where the limit is set to 7. This measurement counts the number of occurrences when there were 7 or more blocks in error.
E32TOT -- This measurement counts the total number of uncorrectable blocks present within the testing time. This number should be “0”.
Length deviation -- The length of each pit and land area is measured and compared to the ideal pit and land lengths. The result is compared for each run length, 3T to 11T, (9 values) with variations preset for each run length.
Jitter -- Jitter is measured individually for pit and land (3T ...11T), 9 times 2 (18) measurements. Each pit and land is measured and then jitter is calculated statistically as a standard deviation, (18 more measurements) according to Philips specifications. This is done for the entire track of the disc. Jitter is the imprecision in the timing of the discrete samples, pit and land transition, when converting from analog to digital or digital to analog. It involves the tracking, timing of synchronous clock, and any imperfections on the disc. In general this measurement is a good indication of overall disc data quality.
You may also view or download the above information here.